Charts & Infographics

Social Distancing When Boating
Enjoy your boat, the water and the fresh air; but enjoy it while boating responsibly.
Read More
Spread Awareness About Safe Boating
This one-sheet outlines the different safe boating programs from the Sea Tow Foundation.
Read More
Lightning Safety
Lightning is a serious concern when you’re out on the open water. Your best defense is preparedness!
Read More
Defensive Boating
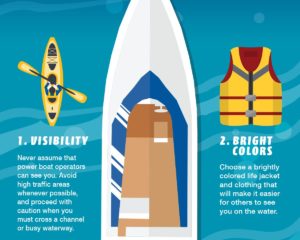
This infographic from the ACA Safety Series explains defensive boating, including visibility, bright colors, environment and knowing the rules of the road.
Read More
Boat Capacity
The number of people allowed on a boat at any time is dictated by both the Coast Guard and the manufacturer specifications for each boat.
Read More
Deaths, Injuries & Accidents by Year, 2000-2019
Boating deaths, injuries and accidents by year, from 2000 to 2019.
Read More
Percentage of 2019 Boating Accidents by Month
Chart and table showing the percentage of boating accidents that are fatal, by month, in 2019.
Read More
Distribution of 2019 Recreational Vessel Registration by State
Distribution of 2019 recreational vessel registrations by state.
Read More
Common River Hazards and Obstacles
Graphical guide to common river hazards and obstacles, and how to deal with each.
Read More
New Life Jacket Label Guide
A guide to the new life jacket label, including Performance Level, Turn Ability and Warning Symbols.
Read More
Distribution of 2019 Boating Deaths by State
2019 boating deaths distribution in the United States
Read More
Fatal Boating Accidents by Location
Fatal boating accidents by location, in the continental U.S. and Puerto Rico.
Read More
Boating Deaths by Vessel Power (2019)
2019 Boating deaths, by vessel power, including human-power, motor, sail and others.
Read More
Percent of Deaths by Vessel Type, 2005-2019
Graph of boating deaths showing percentage by vessel type, from 2005 to 2019.
Read More
Annual Recreational Boating Fatality Rates 2000-2019
A graph and data table showing annual fatality rates, with motorized occurrences broken out.
Read More
Info-link: U.S. Large Cruiser Market Snapshot
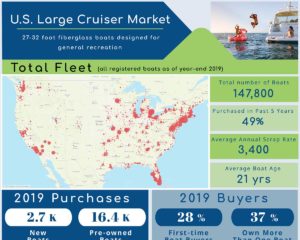
Large Cruisers are fiberglass, inboard, stern drive and outboard boats that are between 27’ and 32’ in length. They typically offer extensive amenities, including the ability to take shelter from weather. They are common in both salt and larger freshwater environments and are usually used for general recreation and relaxation.
Read More
Info-link: U.S. Yacht Market Snapshot
Yachts are fiberglass stern drive, inboard, and more recently outboard powered boats 33’ and larger in length. They offer extensive amenities and comfortable living accommodations for extended cruising. They are found in both salt and larger freshwater environments. This segment includes trawler style boats but does not include houseboats or offshore fishing boats.
Read More
